RabbitMQ Integrates with Grafana Cloud for Enhanced Monitoring
July 18th, 2024
00:00

00:00
Summary
- RabbitMQ, a key message broker, integrates with Grafana Cloud.
- Enhanced monitoring, alert capabilities now available for users.
- Integration supports RabbitMQ version 3.8+, available on Grafana Cloud.
- New features include advanced dashboards and critical alerts for proactive management.
Sources
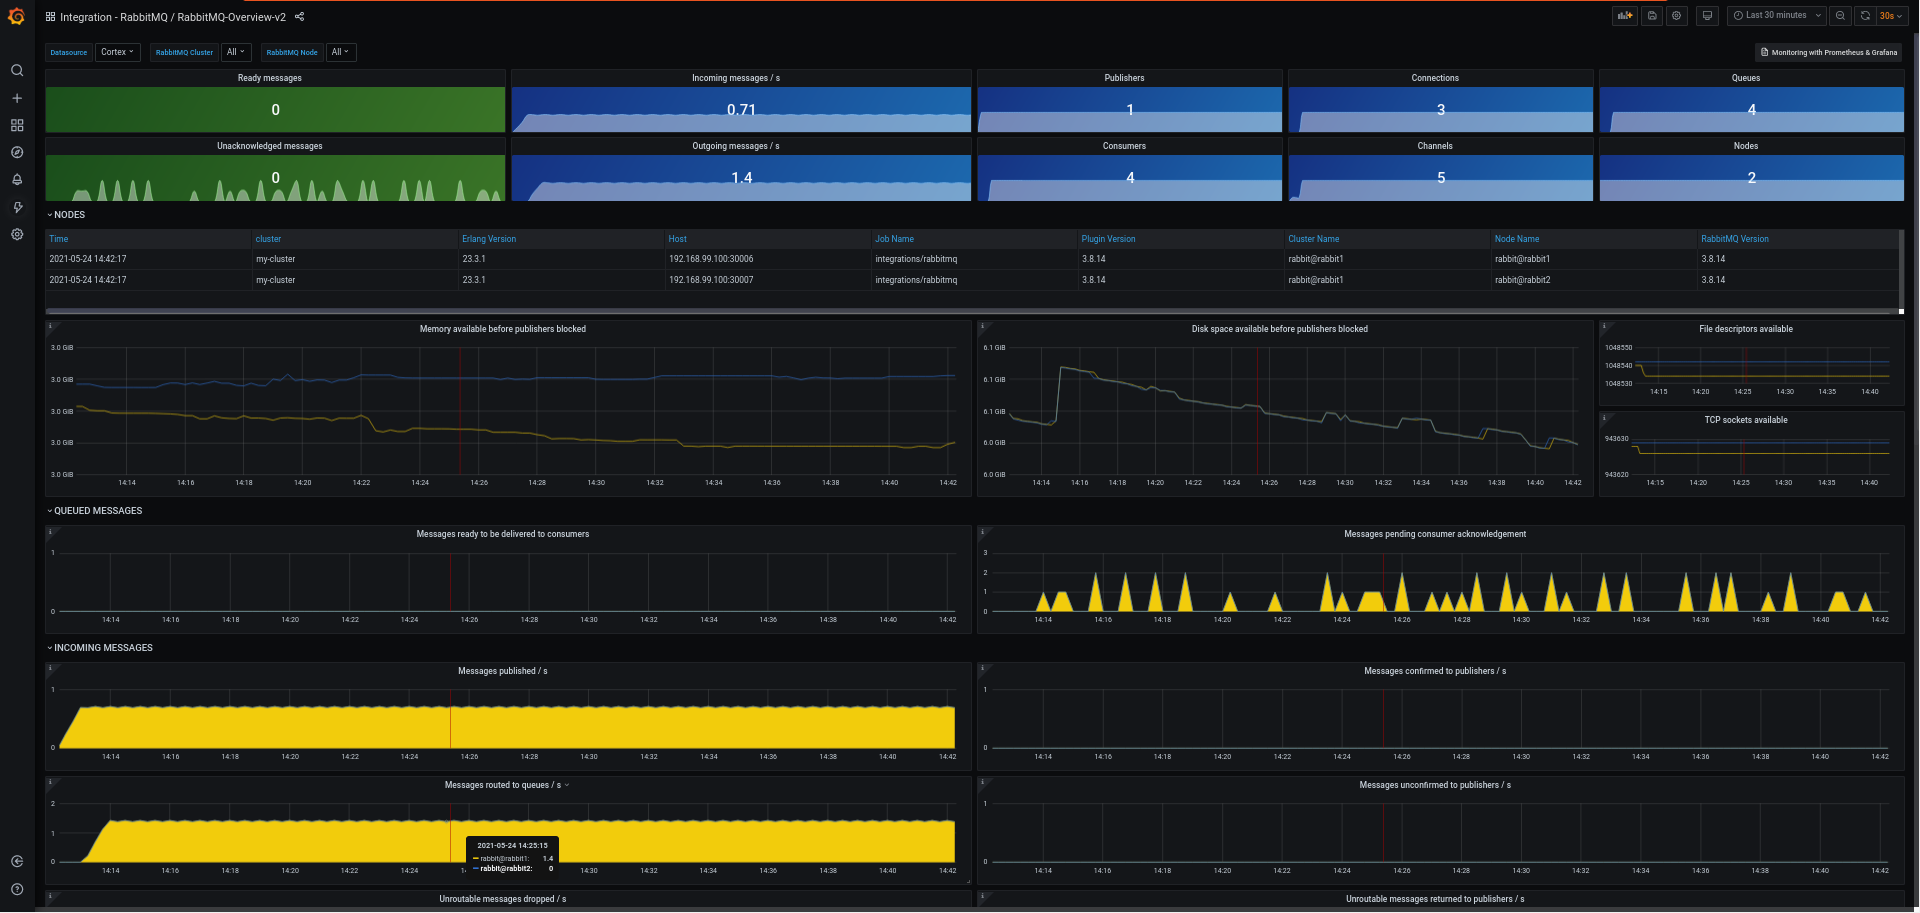
The integration of RabbitMQ with Grafana Cloud marks a significant advancement in the field of observability. This collaboration brings a powerful tool to the hands of users who rely on RabbitMQ, one of the most popular open-source message brokers. Known for its versatility in deployment across both on-premises and cloud environments and its support for multiple messaging protocols, RabbitMQ is widely adopted globally. Grafana Cloud, being a composable observability platform that combines metrics, logs, and traces within Grafana, now allows users to effectively monitor and alert on crucial RabbitMQ cluster metrics. This is achieved through the Grafana Agent, a lightweight observability data collector that is optimized for sending metric, log, and trace data to Grafana Cloud. The community around RabbitMQ had already developed robust dashboards that provide a general overview of a clusters health, memory consumption, and other key metrics. Building upon these existing resources, additional work was undertaken to enhance these dashboards with more filtering options. This enhancement enables users to drill down to the node level while also aggregating data to view the overall cluster status, making the dashboards versatile across different infrastructures, including those not based on Kubernetes. The integration isnt just about monitoring; it also encompasses critical alerting functionalities tailored to avoid false positives while addressing common issues that might arise in any environment. Packaged with the integration are five key alerts: - RabbitmqMemoryHigh, which triggers when a node is consuming ninety percent of allocated memory, - RabbitmqFileDescriptorsUsage, indicating when a node’s File Descriptor usage is nearing its maximum, - RabbitmqUnroutableMessages, alerting when the cluster fails to deliver messages to a destination, - RabbitmqNodeNotDistributed, which alerts users to a node losing communication with the cluster, - and RabbitmqNodeDown, signaling when a node is down. This integration is easily accessible to users, requiring only a single click to activate for Grafana Cloud users. It supports RabbitMQ version three point eight and higher, which includes an official plugin that simplifies activation without the need for dedicated infrastructure or specific binaries. For users not yet on Grafana Cloud, the service offers both free and paid plans, accommodating a variety of use cases. This integration not only simplifies the user experience but also enhances the capability to oversee and maintain the health of RabbitMQ clusters effectively.